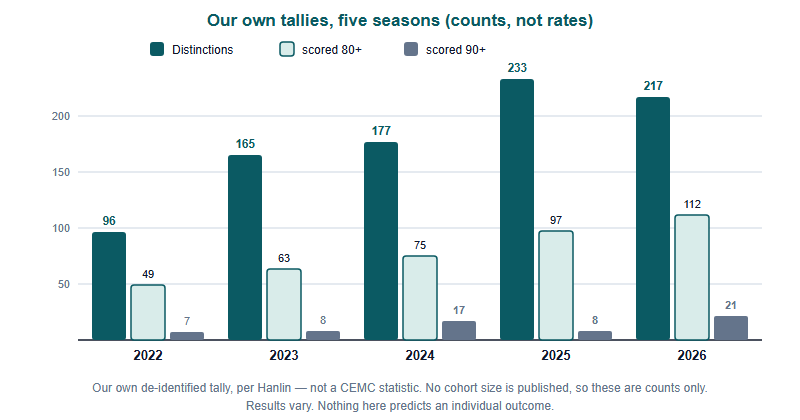
Across the five Euclid seasons from 2022 to 2026, our own students earned 96, 165, 177, 233 and 217 Distinctions, and the number scoring 90 or above went 7, 8, 17, 8, 21. Those are counts, not rates, and the difference matters more than the numbers do. This article publishes the figures and then explains how to read them — including ours.
The figures, stated plainly
Everything in this section is our own internal tally of our own students, de-identified, reported per Hanlin. It is not a CEMC statistic, it is not audited, and it describes the students who happened to work with us in each of those years. Results vary between individuals and between cohorts.
| Season | Distinctions | Scored 80+ | Scored 90+ | Change in Distinctions |
|---|---|---|---|---|
| 2022 | 96 | 49 | 7 | — |
| 2023 | 165 | 63 | 8 | +69 (+72%) |
| 2024 | 177 | 75 | 17 | +12 (+7%) |
| 2025 | 233 | 97 | 8 | +56 (+32%) |
| 2026 | 217 | 112 | 21 | −16 (−7%) |
Two individual results sit inside those totals: a student scored a perfect 100 in 2026, and a student scored 99 in 2024.
The first rule: a count is not a rate
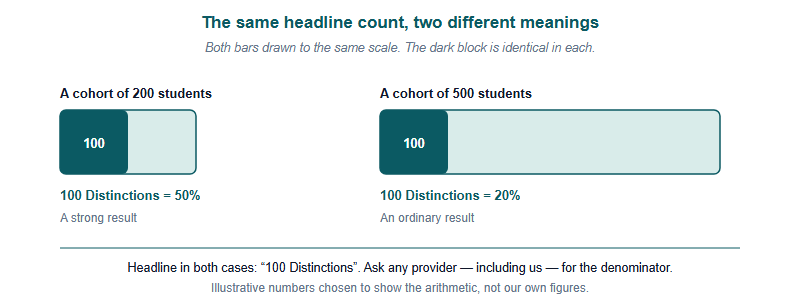
Every education provider in this market publishes counts. Almost none publish denominators. That asymmetry is not usually dishonest, but it does make the numbers far less informative than they look, and the effect is worth seeing rather than being told about.
We have not published how many students sat the paper in each of those years. Without that figure, a rise from 96 to 233 Distinctions is compatible with two completely different stories: teaching that got better, or a programme that got bigger. Both produce a rising line, and from the outside you cannot tell them apart.
There is a second confounder specific to this contest. Euclid is re-set every year, and the papers are not equally hard. CEMC publishes score information for each contest, and both the distribution and the level at which Distinction falls move with the paper. That means a year-on-year comparison of Distinction counts silently compares two different tests. If you want to compare across years properly, look up the published figures for each of the years you are comparing on cemc.uwaterloo.ca rather than assuming the bar sat in the same place.
So what should you do with numbers like ours? Treat them as evidence that a programme has real volume and real results at the top end, which they are. Do not treat them as a measured effect size, which they are not. The correct question to put to any provider — us included — is: out of how many, and what happened to the students who did not make the list?
What the shape does show: the top tail moves on its own
With the caveats in place, there is one genuinely interesting pattern in the table, and it is not the growth in Distinctions.
Look at 2025. Distinctions hit their highest point in the series at 233, and the 80+ group also reached a new high at 97 — but the 90+ group fell to 8, less than half the previous year's 17. Then in 2026 Distinctions fell to 217 while the 90+ group jumped to 21, the highest in the series. The broad band and the top band moved in opposite directions in both of those years.
Expressed as shares of the Distinction count, the pattern is easier to see:
| Season | 80+ as a share of Distinctions | 90+ as a share of the 80+ group |
|---|---|---|
| 2022 | 51% | 14% |
| 2023 | 38% | 13% |
| 2024 | 42% | 23% |
| 2025 | 42% | 8% |
| 2026 | 52% | 19% |
The 80+ share stays inside a fairly narrow 38–52% band. The 90+ share swings from 8% to 23% — roughly a threefold range. That is a real signal about how the scale works, and it has a practical reading: getting into the Distinction band and getting to the very top of the paper are different achievements with different determinants.
Our own coaching view on why is straightforward, and it is a view rather than a measured finding. Reaching the Distinction band is mostly about breadth and reliability: knowing the standard techniques, not making arithmetic errors, and writing enough on the full-solution items to bank the available method marks. That is trainable and it is stable year to year. Clearing 90 requires solving at or near the end of the paper, where one or two very hard questions sit, and whether a particular student can do that in a particular year depends heavily on what those specific questions happen to be. The last few marks are where a paper's individual character shows up most.
The practical consequence for a student is that the reliable gains live in the middle of the paper, not the end. A candidate hunting the last question while still dropping method marks on question 7 has the priorities inverted — which is why how step marks work is more valuable to most candidates than another attempt at question 10.
Why the 90+ number is the least reliable figure on this page
It is worth naming the statistical reason the top band jumps around, because it applies to every results claim you will read this admissions season.
Small counts are volatile in a way that large counts are not. Our 90+ series is 7, 8, 17, 8, 21. Those are single- and low-double-digit numbers, so a handful of students shifts the figure by a large percentage. A move from 8 to 17 looks like a doubling of quality; it is nine students. Meanwhile the Distinction series, being an order of magnitude larger, moves in comparatively smooth steps.
Three consequences:
- Never read one year of a top-tail number as a trend. Any provider can have a good year at the very top by ordinary variation, and any provider can have a flat one.
- Be sceptical of the single best number. A perfect 100 is a real achievement by a real student — and one student. It tells you the ceiling is reachable, not how likely you are to reach it.
- Prefer the broad bands. If you are trying to judge a programme from published figures, the wide band with the big denominator is a more stable indicator than the elite band with the small one.
We are aware this argument cuts against our own marketing interest. We would rather readers could evaluate our numbers properly, because a reader who understands why the 90+ figure is noisy is also a reader who correctly weights the 112 students who cleared 80 in 2026.
What a Euclid record is actually for
One last point, since result counts and admissions get discussed as though the link were mechanical. It is not, and we will not claim it is: no contest result causes an offer, and nothing in the data above should be read as predicting an individual's admission or scholarship outcome.
What a contest record does is narrower and genuinely useful. Waterloo's own contest materials describe results as helping to demonstrate sufficient mathematical background, and note that this is especially useful in cases where they may be unfamiliar with an education system — wording worth confirming for yourself on cemc.uwaterloo.ca.
For a student at an international school in China, that sentence is the whole argument. Your school's grading scale, curriculum and internal ranking may be genuinely unfamiliar to an admissions reader on another continent. A contest sat on the same day, on the same paper, marked to the same standard as tens of thousands of other candidates, is a shared unit of measurement. It is an information channel, not a lever.
That also means the useful preparation question is not “what number do I need” but “can I produce work an unfamiliar reader would find convincing”. Entry runs through a school or authorised test centre, with the 2027 chain set out on our 2027 key dates page — and the earlier you settle that logistics question, the more of the season is left for the part that actually moves your score.
Frequently asked questions
Are these figures official CEMC statistics?
No. They are our own de-identified internal tallies of our own students, reported per Hanlin, unaudited. Results vary.
Why not publish the number of students who sat each year?
Fair question, and the right one to ask any provider. Without a denominator, counts show scale and top-end results but not an effect size.
Can Distinction counts be compared across years?
Only loosely. Papers differ in difficulty each year, so check the published score information for each year on cemc.uwaterloo.ca.
Does a strong Euclid score secure admission or scholarships?
No. A result is evidence of mathematical background, not a cause of any offer. Treat all admissions claims about contests with caution.
Operated by Hanlin Education for China-based international-school students. Cohort figures above are our own de-identified tallies, not official statistics; confirm all contest details and published score information on cemc.uwaterloo.ca. Errors reported to us are corrected within 7 working days.